
The is a follow-on post to the Basics of Python in Power BI post. The idea behind the first post was to illustrate the most basic of Python integration in Power BI by keeping the Python code to a bare minimum. In this post I want to try and cover the basics of Pandas dataframes as this appears to be the primary way for Power BI to recognize data delivered via a Python script. Keep in mind that when I say “basics”, I am referring to dataframes in relation to Power BI. Also the results are from a discovery process with the preview, not from any Power BI reference material.
As a data science tool, the Python fundamentals to really master are data structures. DataCamp has a great post on the basics of data structures. In my brief journey with Python thus far, the built-in data structures I have needed to get to grips with are lists and dictionaries. I’ll cover the basics of lists and dictionaries in future posts. For now we will focus on Pandas dataframes, not just because it is supported in Power BI, but because the data science universe says so!
Dataframes
Pandas is a very popular Python package for data science because of its ability to manipulate and analyze data. This is possible because of data structures such as dataframes. The good news for Microsoft data platform folk is that Pandas shares many similarities with SQL, so much so that the Pandas documentation includes a comparison with SQL.
DataCamp defines a dataframe as “two-dimensional labeled data structures with columns of potentially different types” and “you could say that the Pandas DataFrame consists of three main components: the data, the index, and the columns”. For now, in order to get to grips with dataframes, lets think of it as a table with an index.
Recall how we read the CSV file into a Pandas dataframe in the previous post:

The original file had 2 columns. When we used the read_csv method to add the file content to the dataframe, the index was automatically added.
Note: throughout the post I am using the head(5) method to display the top 5 records. You don’t need this in Power BI. In fact Power BI ignores this as it does not modify the dataframe.
Mind the index
When we use the Python script in Power BI, it does not display the index.

If we have our own index column in the data e.g. ValueDate, we could specify the index column as a parameter in the read_csv method as follows:

As we have noted, Power BI does not display the index … even if it is one of the data columns!

It may be of interest that the to_sql method includes the index column when loading to SQL. I’ll blog about this in a future post as a reference for those who want to persist their data to SQL.
Watch the data types
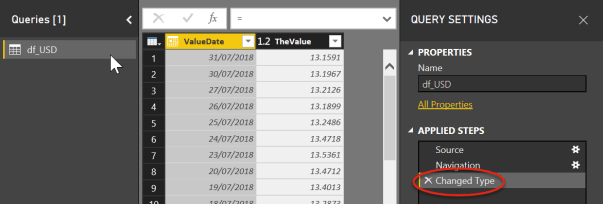
While I am unable to recreate the scenario, I had a case where Load vs Edit displayed different behavior in the Query Editor. In this scenario, Edit did not show the Change Type step. In this case I manually changed the data types to date and decimal.
I tried to overcome this by forcing the data types to be set during the read_csv method by parsing the date and setting the data type for TheValue as float. Data types for read_csv can only be set to string, float or int (integer). If we compare the raw date vs parsed date, we will see that the raw date is treated as a string.
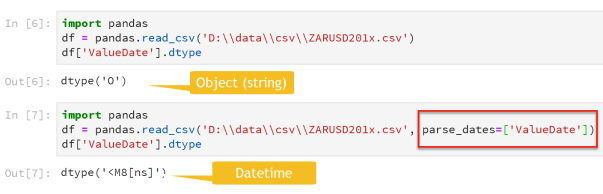
Although TheValue is correctly detected as float, we can ensure that the column is cast as float by adding the dtype parameter to the read_csv method.

It appears that Power BI still applies a Change Type step regardless of this.
This is not really an issue, but it is useful to know that the read_csv method can handle data type changes including decimals with a comma or dates in other formats. Perhaps this will change in Power BI in the future.
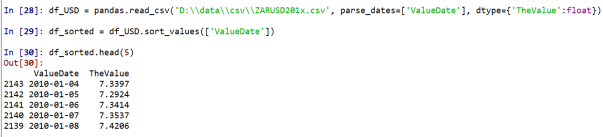
Sort for compression
I am not the expert about the technicalities of compression, but I read a blog post by Matt Allington discussing the impact of unsorted data on large data models. Since its easy to sort data with a dataframe, we may as well apply this to our code to avoid potential pitfalls.
Or we could write it like this:

Summary
Dataframes are powerful data structures. We have scratched the surface by touching on specifics that may affect Power BI. This includes dataframe indexes, dealing with data types and sorting data.
For more info on handling CSV files (headers, skipping rows, missing values, etc) I’ll have to send you to DataCamp.
Disclaimer: I am in no way affiliated to DataCamp, but find the content incredibly useful for getting started with Python.

Great article, builds nicely on the first one.
[…] is part 3 of the Basics of Python in Power BI series and builds on from the previous post about Python dataframes. In this post we show you how to import files from a folder using Python. […]