
… and why you should be interested.
Technology is a business enabler. Our mind-set must be one of solving business problems and then determine how technology will help solve the problems. The first pass for evaluating technology requires an initial understanding of the key concepts rather than platforms and architecture. In this post I’ll try to demystify what Power BI 2.0 is. It has its origins in Power BI version 1 which was preceded by Power Pivot, and this may have left a trail of confusion. As a rapidly evolving platform the information in this post may be out of date, or simply incorrect because I have misunderstood some concepts or features.
Power BI is labelled as a Business Analytics suite. There is much confusion and variation around the term Business Analytics, so I am surprised that Microsoft used this label. While I am not going to attempt to define business analytics, it is sufficient for the purpose of this post to say that it encompasses self-service BI and also refers to a continuous and iterative analytics process that matches the business need for speed, agility and a forward/future focused analytics approach.

I like to describe Power BI as a solar system. The Power BI Service is the sun in this solar system. This solar system belongs to the Cortana Analytics galaxy in the Microsoft universe.
Rafal Lukawiecki provided a very simple but elegant explanation of Cortana Analytics during a keynote at SQLSaturday in Johannesburg (slides available here). Also have a look at the example of Cortana Analytics in healthcare. But back to Power BI …
The Power BI Service is the glue between the user and the data. This analytics function is supported by content builders who create reports, dashboards and content packs. The content is further enhanced through features such as natural language query, data driven alerts, annotations and sharing.
To gain a better understanding of this over-simplified view, we have to navigate the map of the Power BI solar system. The original idea of this layout came from a Jen Underwood slide, but I have adapted this with in an attempt to pack more detail and context into a single image.
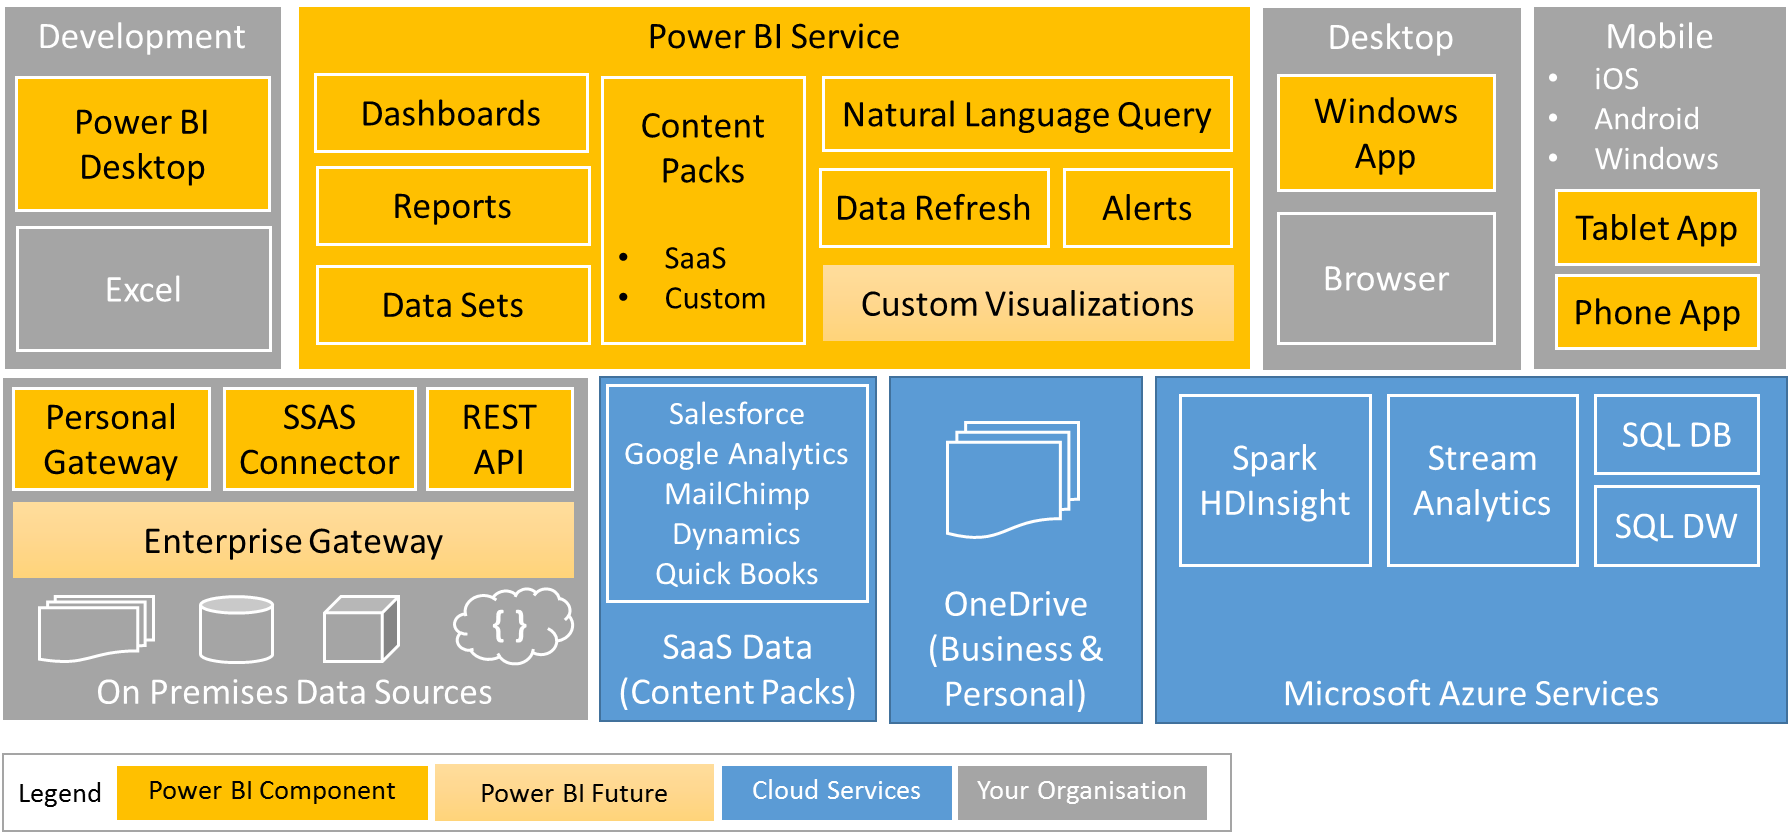
Navigating the map is reasonably simple. There are 4 areas to review:
- Source Data (entire bottom half of the image)
- Development Tools (top left hand corner)
- Power BI Service (top center)
- Data Presentation and Exploration (top right hand corner)
Source data is the data you want to surface insights from. This data may reside in files, databases or accessible via services. The data may be on-premises or in the cloud. The data may be public or private. The data may be raw (transactional system data), curated (data warehouse data) or packaged (content packs) for end user consumption. A personal gateway lets you connect to data on your laptop/device. While a connector is available for on-premises SQL Server Analysis Services, it is the much anticipated enterprise gateway that we patiently are waiting for. But even more exciting are the possibilities with the Power BI Rest APIs that allow organisations to create custom applications that can push data directly to the Power BI service.

To author content for Power BI we need a combination of the Power BI Desktop tool (or Excel with the Power add-ins) and the Power BI Service. Power BI Desktop and Excel are self-service BI tools that are more than capable of delivering “power user” features for data integration (ETL), data modelling and report building. Officially Excel is not part of the Power BI suite, but Amir Netz has promised much love for the Excel crowd and Office 2016 is proof of this (currently in preview and rolling out from 22 September). Excel 2016 preview sports the same version of the tabular model engine that is currently available in Power BI Desktop. Transition between the tools is not what users are hoping for yet, but this is outside of the scope of this post.
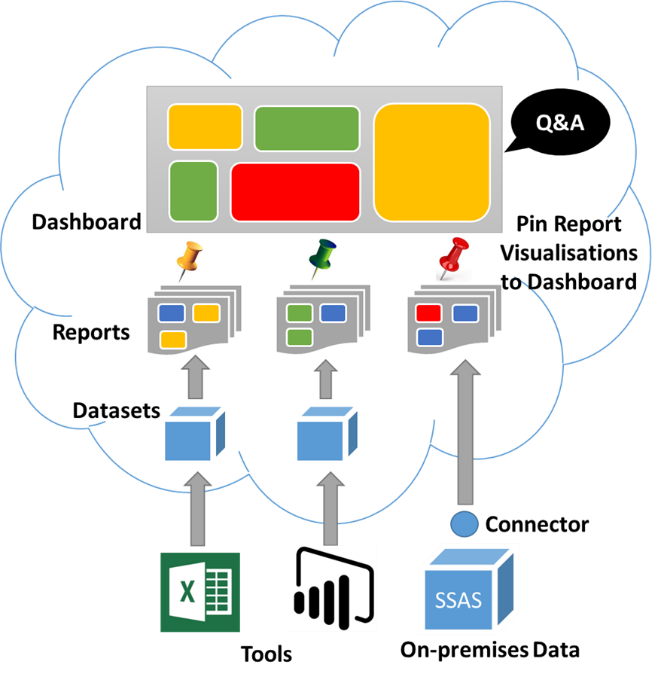
Once a Power BI Desktop (or Excel) solution has been created, the content can be published to the Power BI service. The service becomes the host for the queries, data (model) and reports. The only parts of the solution that can only be created in the service are the dashboards and content packs (prepacked solutions including dashboards). These content packs could be commercially packaged solutions or custom content packs created within your organisation. The service includes a natural language query feature at dashboard level that lets you type in questions that are answered through data or data visualizations. The service also manages data refresh, alerts and annotations.
Finally there is the end user experience. Content can be accessed via browsers (yes, Chrome and Safari are supported), via the Power BI application (in the Windows Store) on Windows 8 & 10, or via mobiles devices (phones and tablets … it appears that Apple devices are a priority). The tablet experience is richer than the phone in that it can drill down to underlying reports which the phone app can’t do.
Overall the Power BI offering from Microsoft ranks high in completeness of vision both as a standalone business analytics suite and as a solar system within the Microsoft universe that offers companion platforms such as SQL Server, HDInsight, Machine Learning, etc. As a new product, ability to execute is reasonable with a demonstrated commitment to incremental delivery. The service is currently updated weekly and Power BI Desktop monthly. The Power BI team in Microsoft has a keen ear for customer input which bodes well for future expansion of this solar system.
More compelling though is that Microsoft are opening up parts of the platform to developers. Custom visualization is a very clever response to the data viz reputation of products like Tableau. REST APIs are a powerful means to embed analytics in your organisations application & data architecture, and entrenches the Microsoft integration capability.
While the marketing material talks about any data, anywhere, any way … it is the lesser emphasized platform to extend and build on (rather than replace) that I find attractive.

[…] Power BI is the business analytics offering from Microsoft. It is a combination of tools, services, mobile applications, etc. It is an offering that cant be ignored in terms of how it serves as a vehicle that brings together corporate, self-service and end-user BI. To learn more about Power BI have a look at the following blog post. […]